SpoolCast: Making Data Engaging: A Talk with the New York Times Interactive Design Team
SpoolCast: Making Data Engaging: A Talk with the New York Times Interactive Design Team
Recorded: December 11th, 2007 from the studios at UIE.
Brian Christiansen, UIE Podcast Producer
Duration: 24m | File size: 13MB
[ Subscribe to our podcast via iTunes. This link will launch the iTunes application.]
[ Subscribe with other podcast applications.]
[ Text Transcript ]
Podcast: Play in new window | Download (13.6MB)
Subscribe: iTunes | Android | RSS
Today’s podcast features a fascinating conversation I had with New York Times graphic journalists, Andrew DeVigal and Steve Duenes.
Andrew and Steve are part of the team responsible for taking data and raw information from the day’s news and turning it into highly interactive and informative online experiences.
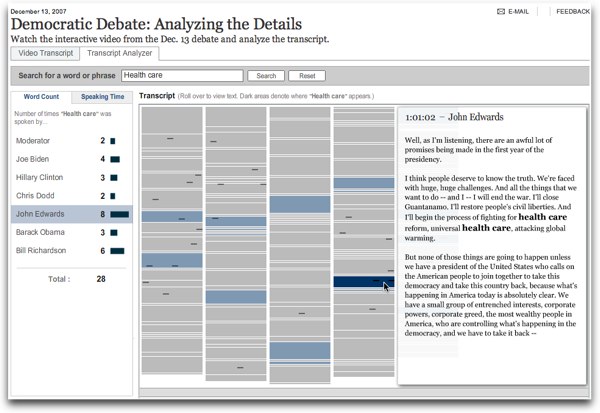
For example, the team built the NYTimes Debate Analyzer, a tool to explore the presidential debates. Readers can see how frequently a specific term, such as “health care” or “iraq”, is mentioned by each candidate. They can scroll to a specific answer in the transcript and the video automatically plays that section, bringing an entire new way to experience the debates.
In this discussion, we also examined some of the NYTimes.com’s other amazing interactive graphics and multimedia applications, including:
- Paths to the Top of the Home Run Charts – An interactive chart showing how quickly record holders beat the MLB home run record
- Trailer Living, Then and Now – Explore how vacation trailers have changed over the years
- Exonerated, Freed, and What Happened Then – An multimedia exploration of 200 prisoners exonerated by DNA evidence
I think you’ll enjoy my conversation with Steve and Andrew. You’ll learn a great deal about the their journalistic techniques for building for successful interactive online experiences.
I’m also greatly anticipating their presentation this March at our Web App Summit in San Diego, California. They will present the talk, Engaging an Audience: Using Out-of-the-Box Thinking to Create Great Designs.